
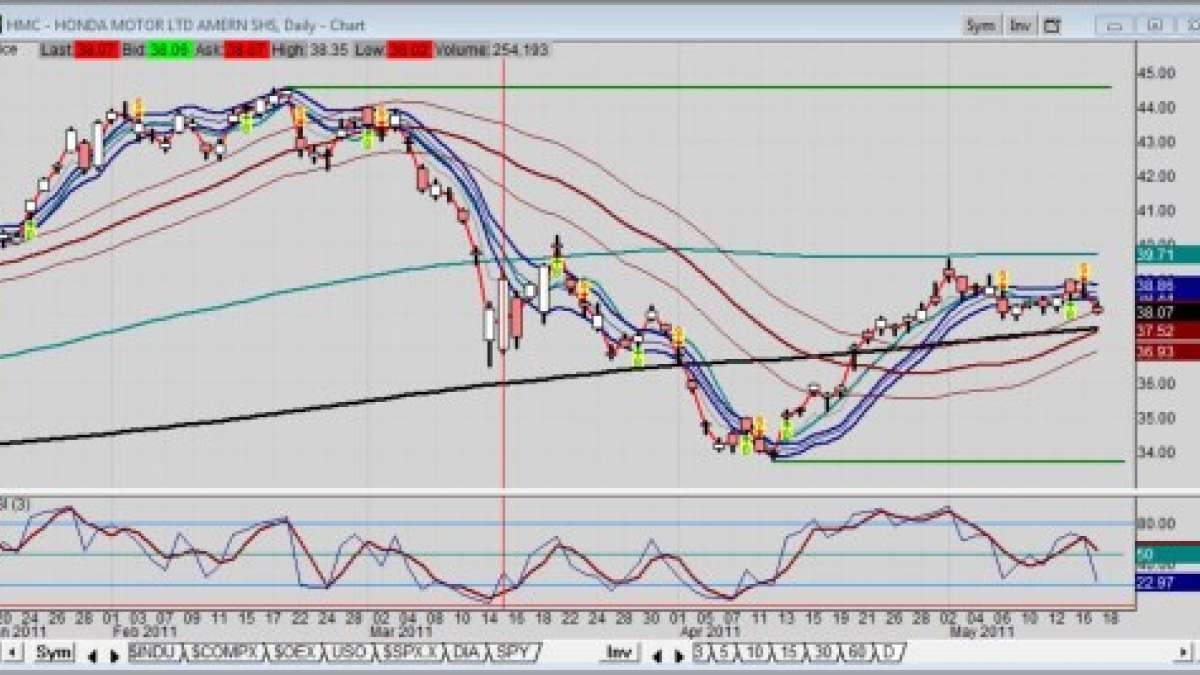
The snapshot of Homda stock daily chart taken early this morning shows a major move to the downside into April with a stellar rebound into May above the 200-day moving average. This is just one of the technical analysis tools used by traders and fund managers to determine a stock’s relative strength.
On the fundamental side, though, Honda has a more than just home port problems. According to a previous article by TN writer, Patrick Rall, Honda has already issued a new recall of 833,000 vehicles to address an airbag issue. Read article here
For the record, this relates to the same issues that accounted for the airbag recalls between 2008-2010.
Beyond that, Patrick also reported on a fuel pump recall for the Civic. Together, these makes for bad press when the stock is already under pressure fundamentally.
Point is, Honda stock was a steady performer during the Toyota recalls. Now we see Honda production was suspended at factories in the ravaged Tochigi area. Among the most crucially affected was the Tochigi Factory, where the Honda R&D Center and the Honda Engineering facilities are.
Second point is, fundamentals do affect stock, no matter what the technicals say in the interim. Eventually they have their way into the bottom line, even with a great performer like Honda.
Honda Stock Chart
So, what we have thus far is a stock with an April low of 33.76 and a May high thus far of 39.58. As of today, Honda stock is trading down at 38.04 as of 11:39 a.m.
Question is, can Honda stock hold above the 200-day moving average at 37.59? Of course, only time can tell, but time is affected by news and the expectations of fundamental performance like earnings with all the issues in mind.
On the weekly chart view, the stock looks like it’s holding its own. However, note the volatility since February. The high was 44.56 countered by the April low of 33.76. That means Honda stock is trading below the 39.13 midpoint of those two price swings.
---------------------------------------------------------------------------
Disclosure: Frank Sherosky, creator of stocks charts for TN is author of "Awaken Your Speculator Mind" but does not hold any stock, option or futures position in this equity or futures at this time.
---------------------------------------------------------------------------
More About the Reporter: After 39 years in the auto industry as a design engineer, Frank Sherosky now trades stocks, futures, and writes articles, books and ebooks via authorfrank.com. He may be contacted here by email: [email protected]
________________________________________________
Additional Reading:
Honda Civic GX the only natural-gas passenger car at 2011 Detroit Auto Show
Honda stock a steady dream performer amid Toyota recalls
Toyota stock closes up despite lousy Q1 report and no full-year earnings outlook
GM stock closes higher near IPO price after April sales report
Investors yawn at Ford stock even after upbeat April sales report
50 mpg needed as gasoline futures nears old 3.63 high
Set Torque News as Preferred Source on Google
Follow us today...


