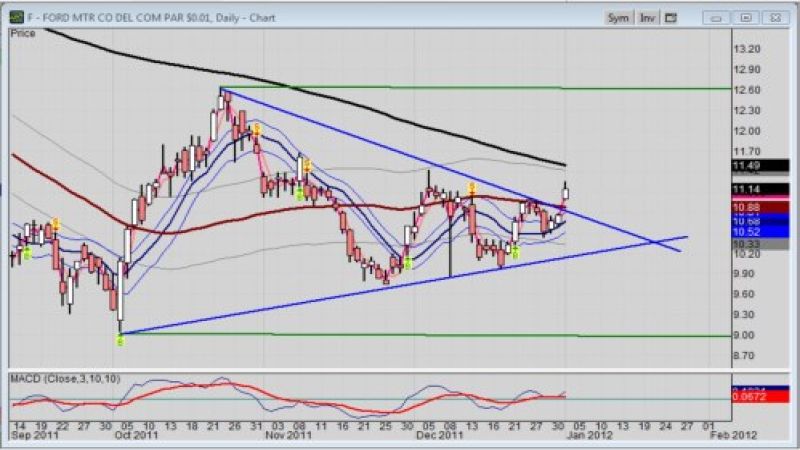
It does not come up all the time or on every stock, but when a converging wedge pattern appears on a stock chart, astute traders take notice; and such was the case today with the stock for Ford Motor Company (NYSE: F).
Of course, the question in mid-December was, will Ford stock break to the upside or to the downside? My thoughts at the time leaned toward the upside for the simple reason that the 2012 North American International Auto Show (NAIAS) in Detroit; and auto stocks often find price support at a minimum.
For the record, the unique pattern started to form in October, much like an early swirl on tropical depression in the east Atlantic. The low of 9.05 was followed a few weeks later with a swing high of 12.65. From there, two converging blue lines could be drawn. Read my article: Ford stock setting up a potential, technical breakout with converging wedge pattern
Also for the record, these were defined as short-term trend lines; one covering swing highs; the other covering swing lows. From a trading standpoint, this technical setup which was based on price dynamics defined what traders call a classic wedge pattern. It also defined a decrease in volatility, which often acts as a building event for future buying or selling pressure.
In this case, buying pressure built up to the point of release. Now the question is, how far and how long will Ford stock run?
If you were bearish on Ford, then a breakout to lower levels would have been expected. However, Ford has been in a bear funk for some time now; but its fundamentals did not warrant that much bearishness.
If you were long-term bullish on Ford stock, then a quiet scenario like this was a great opportunity to bulk up on call options or sell puts for income while you wait for a breakout to higher ground. That is precisely what I did. I am long Ford call options.
Truth is, I did not know for sure which way Ford would go. After all, certainly there was and still is a lot of heavy economic clouds overhead with Europe, and Ford could still be negatively affected. Furthermore, the Chinese tax on imports from US plants has Ford’s name on its list, no different than GM.
Also note that I admitted I did not know what news would become the catalyst? I knew that frustrated some readers, but I learned a long time ago to let the market tell me what it’s doing; and now we know. Ford stock has buyers coming which overpowered the bears. However, be apprised that a single day does not define a trend; it’s merely an event that needs further confirmation. And the best confirmation is higher highs and higher lows in the coming days and weeks.
Chart Strategy
How far might Ford stock move per this wedge breakout? Technicians like to use the distance from the pattern’s initial swing low or high followed by the level at which the breakout passes the wedge line. In the case of Ford stock, we have the major swing high and low as potential targets. Furthermore, the October swing high of 12.65 stands as a major resistance. After that level is breached, the 52-week midpoint of 14.01 is then feasible; but that depends on the volume of new buyers that may or may not come into the market at this point and in the following weeks.
Again, we have the 2012 NAIAS as a heavy wind to our backs, but beware of black swan events. They can occur without notice, like a battle with Iran at the Straits of Hormuz.
According to one of my favorite world-watch resources, Whiskey & Gunpowder, “It's pretty clear that we're going to see some sort of military action against Iran's nuclear infrastructure, either by Israel, the United States or even NATO. Recent words from Israeli policymakers, U.S. military action and even signals from the markets made that abundantly clear.”
Trade wisely and keep your head up.
-----------------------
Full Disclosure: At time of publication, Sherosky, creator of the auto sector charts for TN, is neither long or short with the mentioned stocks or futures, except some call options on Ford, though positions can change at any time. None of the information in this article constitutes a recommendation, but an assessment or opinion.
-----------------------
About the Reporter: After 39 years in the auto industry as a design engineer, Frank Sherosky now trades stocks, futures and writes articles, books and ebooks like, "Perfecting Corporate Character," "Awaken Your Speculator Mind", and "Millennial World Order" via authorfrank.com. He may be contacted here by email: [email protected] and followed in Twitter under @Authorfranks
________________________________________________
Additional Reading:
2012 Message for Auto Stock Sector investors: Embrace uncertainty
More intrigue behind scenes of Chinese quotas of rare earths
Chevy Volt vs Cruze cost comparison not appreciated by some Volt owners
Toyota stock shows blah reaction to Moody's downgrade of TMMC
GM and J.D. Power attempt to understand the why behind Chevy Cruze sales
GM CEO Akerson dismisses price factor with building 60,000 Chevy Volts in 2012
Auto Sector Stocks: investor resolution ideas for 2012
G-Oil sponsors TriStar Motorsports Toyota Camry team for 2012 NASCAR Nationwide Series
Corporate culture as important as innovation per Booz & Company


Comments
In support of my world-watch
Permalink
In support of my world-watch comments within the article, the Tycoon Report wrote today the following in an email: "If bombs start dropping in Tehran, or missiles end up getting fired in the Strait of Hormuz, it's all bets off when it comes to stocks."
So, others are realizing the potential of things getting dicey in the oil arena, which would affect stocks, especially auto stocks.