


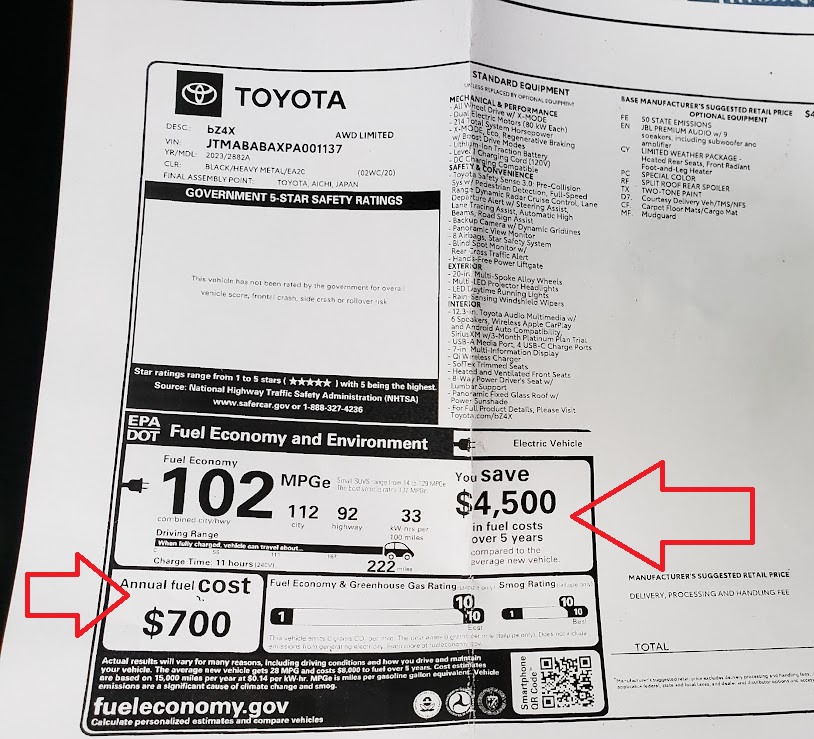
If you visit any new car dealer, you will find a standardized window sticker affixed to every new vehicle. It’s called a Monroney sticker, and it is very helpful in comparing one vehicle against another. Sadly, the folks in charge of that sticker, along with the government’s official website that lists fuel economy and vehicle energy costs, have chosen to exaggerate the energy cost savings associated with a new electric vehicle. This incorrect information is also used by automakers, such as Tesla, in price estimates supplied to shoppers.
Average Miles Driven Are Inflated
The U.S. Department of Energy bases its energy costs and subsequent EV savings on 15,000 miles per year of driving. Why it chose this average is unclear. Sources we have, including government sources, cite much lower average miles driven. We reached out to the DOE, a group we regularly communicate with, and asked, but they opted not to engage in a dialogue on this topic. We made it clear what we were writing about and why we were asking about how they came up with 15,000 miles per year as the average.
What Is the Average Number of Miles Traveled By Vehicles In the U.S.?
To find out what the average miles per year U.S. vehicles travel, we turned to the U.S. Department of Transportation Federal Highway Administration. The latest data we could find listed 13,476 as the total average of miles driven per vehicle per year in America. That factoid is date-stamped May 31, 2022. We don’t know the period for which the factoid was gathered.
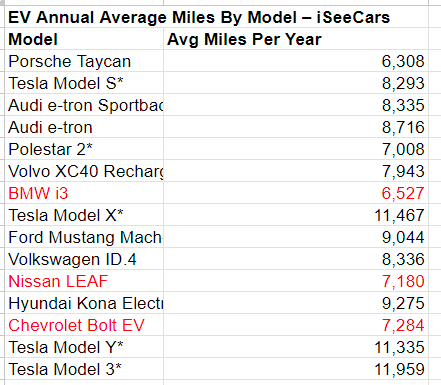
We also turned to iSeeCars.
This publication has a great team of researchers. They have just done a study of 1.3 million recent transitions of vehicles aged 3 years. As part of that study, the team determined the average miles driven per year per vehicle in America. It’s around 12,750 miles. Rather than give us just one answer, they were kind enough to break down the average miles driven by vehicle powertrain type.
Our iSeeCars Data Science Team contact told us, “iSeeCars collected odometer readings from a large sample of 3-year-old used cars sold from November 2023 - April 2024. These odometer readings were then averaged either at the model level or at the drivetrain type level to obtain an average mileage for that model or drivetrain. Then, the average mileage number was divided by 3 to get the average miles driven per year for that model or drivetrain.”
The DOT and iSeeCars both report much lower annual miles driven per car than the 15,000 that the DOE uses. This results in energy savings being exaggerated by approximately 15 to 20%. However, for many popular affordable EVs, the disparity is much greater. The most popular affordable EV over the past half-decade has been the Chevy Bolt. According to iSeeCars’ data, Bolt owners only average 7,284 miles per year. Nissan Leaf drivers average just 7,180. BMW’s i3 averages 6,527, and not a single EV model iSeeCars listed has an average miles per year of 12,000 miles. For these models and many others, the energy savings posted by DOE on Monroney stickers and at FuelEconomy.gov are off by a factor of 50%.
Why It Matters
Helping shoppers compare one vehicle to another, or against an average of vehicles their type when it comes to energy, money, and emissions is a great goal. With that being a primary goal, it doesn’t really matter much what number of annual miles is chosen. Until you bring the EV powertrain into the mix since they drive so far fewer miles than conventionally-powered vehicles. We claim in our headline that DOE is exaggerating the benefits of EVs vs. conventional cars. Here is how we came to that conclusion:
1) The higher 15,000-mile annual miles number artificially increases any differences since our data says that average miles are 20% lower.
2) EVs are driven dramatically fewer miles on average than conventional vehicles. This means that energy savings can be inflated by as much as 50%.
3) Automakers, such as Tesla, use these energy estimates to help sell the EVs.
Why Compare Vehicles to The Total Average MPG?
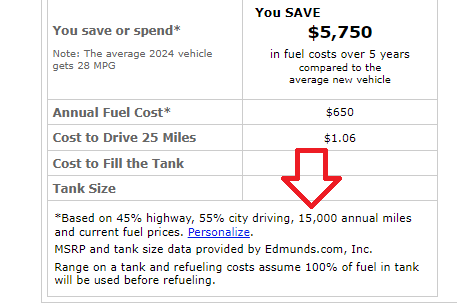
Another way that the Monroney sticker and FuelEconomy.gov skew the energy savings offered by EVs is by comparing their energy costs with “The average new vehicle.” This includes vehicles such as full-size trucks used by contractors and workers and oversized SUVs used by police and other government agencies. Would it not make more sense for compact vehicles to be compared to other compact vehicles, rather than the “average new vehicle?” The reverse is also true. What does the average new vehicle energy cost have to do with your purchase of a full-size pickup truck to be used for a landscaping business? Wouldn’t it make more sense to compare full-size trucks with the average full-size truck?
About “Average” Energy Costs
DOE’s EV energy cost savings are less valid than one might imagine because the cost of gasoline and the cost of electricity are based on national averages. If the costs for gas and the costs for electricity varied from one place to another by, let's say 10%, this would be fine. The cost estimates would work well enough for comparison purposes. However, gas and electricity prices don't vary from one location to another by a small amount, but by a massive amount. The cost of gas in California is about 50% higher than the cost of gas in Massachusetts and both are top states for EVs. For context, check out our story on how we calculated the cost to charge a Ford F-150 Lighting EV vs. a hybrid F-150. Where we tested them, the hybrid had a lower cost of energy per mile.
One other reason the electricity cost issue matters quite a bit is that presently many EV owners charge at home. If EVs are to become mainstream and break out of the 7% of new vehicle sales they have plateaued at, public chargers will be used. And public charging is the most expensive way to power a vehicle. The cost of energy at a public DC fast charger can be double what one would pay at home.
Electricity costs are even more wildly different from state to state. The cost of electricity in Massachusetts and California is nearly triple the cost of many other states, and the cost in Hawaii is about four times the cost of some states. It turns out that the cost per mile for energy of vehicles is very localized. National averages don't lend themselves in any useful way to helping a shopper compare and contrast vehicle energy costs.
Summary - DOE Has A Tough Job, But Can Do Better
We hold the folks at the Department of Energy in high regard. They have a difficult mandate and do a great job in many different ways. However, with EVs headed for the mainstream, shoppers should be offered the most accurate information possible. It is our opinion, based on our research, that DOE exaggerates the energy savings by switching to an EV in multiple different ways.
If you'd like to add a comment under this story, please note that our comments section has returned and is in bold red at the bottom of the page.
Image of Bolt charging by John Goreham. Image of bZ4X data courtesy of www.fueleconomy.gov. Image of bZ4X Monroney sticker by John Goreham.
John Goreham is an experienced New England Motor Press Association member and expert vehicle tester. John completed an engineering program with a focus on electric vehicles, followed by two decades of work in high-tech, biopharma, and the automotive supply chain before becoming a news contributor. In addition to his eleven years of work at Torque News, John has published thousands of articles and reviews at American news outlets. He is known for offering unfiltered opinions on vehicle topics. You can connect with John on Linkedin and follow his work at our X channel. Please note that stories carrying John's by-line are never AI-generated, but he does employ Grammarly grammar and punctuation software when proofreading.
Set Torque News as Preferred Source on Google
Follow us today...


