
When we last reviewed the price dynamics and gap scenarios on Toyota Motors (NYSE: TM) stock, the official introduction of the 2012 Toyota Camry was in full bloom. Well, at least a week has passed and literally nothing has happened positive to the stock. In fact, the price dynamics made a turn for the worse with a downside gap on Friday.
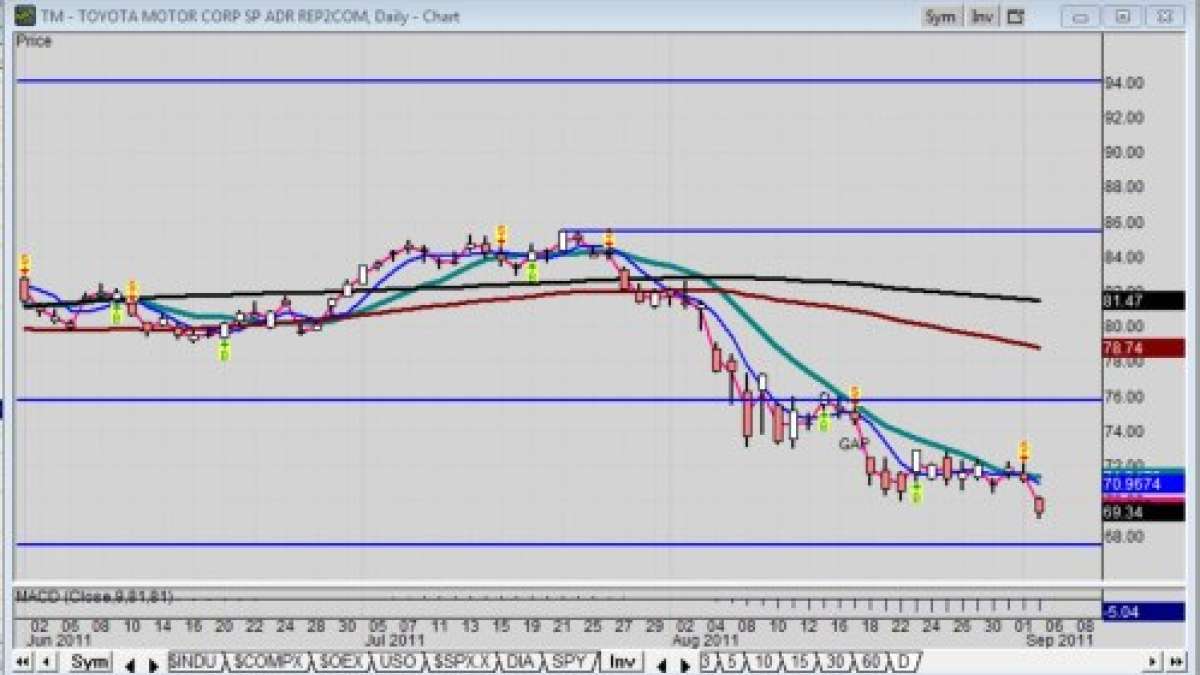
For the record, on July 21, Toyota stock traded at 85.49. Then on July 27 the stock broke downward with a significant price gap which was never even challenged. That was followed by a lower price gap on August 4th which was never challenged either; and that was further followed by another lower price gap on August 18.
As a reminder, a price gap is a technical condition on a stock’s price-time chart where there is a break in price, up or down, that creates a gap that traders never filled any trades. In technical analysis this is known as a price gap, and is a significant event.
Recall that I wrote before that the next level of major price support is 67.56, the low of September 2, 2010; and, so far, that still stands. See the bottom blue line on the chart.
From where the stock closed Friday, the last swing low of 70.05 is officially broken, too. And now that price is deemed overhead resistance; plus there is a new price gap relative to last Thursday’s low. Point: that gap might get filled, but unless the economic news or the Obama speech makes a hit on Thursday, then it may be look out below for Toyota stock as well as all other stocks.
Why most stocks have come up short lately
This poor stock performance in light of good fundamental news about a Toyota product reflects evasion by auto sector stock investors. Yet, the pattern for Toyota stock is not really alone. Check out the anemic charts of Ford Motor Company (NYSE: F) and General Motors Company (NYSE: GM).
Similarity of down patterns implies the entire auto sector is just plain suffering under the heavy weight of a lack of investor demand, period; meaning, the stocks themselves may have plenty of cash, but the general market has other ideas for its money. Well, at least Toyota has some cash, but GM and Ford are still carrying a lot of debt.
On the other hand, my own survey of active traders indicates the general condition of the economy seems to be the root cause of the lack of investor demand. Point is, despite America’s debt position, the American economy is surprisingly not the worst in the world. In fact, most traders view Europe as the having the contagion that has the potential to bring the West down to double dip.
At least the American Fed has the option for a QE3; not that anyone wants it. Likewise, the President will be speaking about a new jobs program on Thursday. Negating real change, at least there’s hope we can believe in for at least an hour or two.
According to many traders and hedge fund managers, Europe is the place to watch. From what I hear and read, Germany is in steep export decline; Greece will likely go it alone; and Italy and Spain are bigger than Greece with debt. And to make matters worse, traders view a new bear market for equities as already in place.
To a buy and hold investor, the temptation will likely be to buy the dips. Astute traders, though, are selling into these rallies. Others are taking off long positions; some are using put options to protect their holdings as a hedge. And that explains why a stock like Toyota has been going nowhere but down lately.
Does this mean Toyota won’t go up at all this week? No, anything can happen, and it may very well ride the next upward bounce. Just beware that the bounce will likely be short lived. In their minds, this is the time to trade, not buy and hold.
More technical analysis
Again, the next major support for Toyota stock is 67.56, that lower horizontal blue line on the chart shown. Watch for a buyers coming in at that level; that is, if Toyota stock continues to drop from Friday’s down close at 69.34.
Come to think of it, the last time Toyota stock tested the 70 level was June 2010 through November 2010. Point is, that price level was great for buyers then. Question is, will it be again?
If not, and the 67.56 low of last year is broken, too, the next price support level can be found at the March 2009 low of 56.78. That’s not a projection, just an analysis of where prices have already been and where buyers came back in the past.
Full Disclosure: At time of publication, Sherosky, creator of the auto sector charts for TN, is neither long or short with the mentioned stocks or futures, though positions can change at any time. None of the information in this article constitutes a recommendation, but an assessment or opinion.
-----------------------
About the Reporter: After 39 years in the auto industry as a design engineer, Frank Sherosky now trades stocks, futures and writes articles, books and ebooks like, "Perfecting Corporate Character," "Awaken Your Speculator Mind", and "Millennial World Order" via authorfrank.com. He may be contacted here by email: [email protected] or via his Twitter i.d. @Authorfranks
________________________________________________
Additional Reading:
Labor Day Message to President Obama: Jobs are not political pawns
Split-cycle engine technology to challenge EVs and hybrids
Ford stock may be fairly priced after all
General Motors stock plunges below support toward book price
Michele Bachmann fails to deliver how she would achieve 2 dollar gasoline
Dow Jones US Autos and Parts plunges lower with general market
CAR MBS 2011 reveals auto industry still uncertain on next IC Engine choices
State business ranking by CNBC reflects same criteria important to auto industry
Set Torque News as Preferred Source on Google
Follow us today...


