
The weekly charts shows a lower left to upper right bias.
For the record, today’s pre-market action of the general market as noted by the ETFs SPY, DIA, QQQ and IWM did not help the auto sector stocks. All were still down just before the opening bell.
Indeed Ford has made a phenomenal run since last year. Even Jim Cramer of CNBC’s Money touts Ford stock as best of breed, and did a show late last summer in Dearborn. He might say to back up the truck on sell-off opportunities such as this.
From a fundamental perspective, Ford as a company has solid automotive technology, smart looking designs and a lineup of vehicles that people just plain like. Furthermore, the stock fundamental picture still looks solid with one caveat; the economy, oil, gasoline and the dollar can affect future earnings. Then again, that applies to all auto sector stocks.
While an IPO, like GM stock doesn’t have any past history of price dynamics that would define potential support and resistance like mature trading stocks, that is not the case with Ford who never took government money as a bailout. At this point in time, we know about upside limits as well as the downside limits.
Truth is, there are two limits to the downside that applies to all stocks. They are the book price and the zero level. Of course, Ford stock has a solid book value that would stand as a support level, but it too has billions in debt never got wiped out like GM via bankruptcy. So, the only recourse for traders and investors alike is to use technical analysis for future reference points.
These are not promises, just points on a line of probabilities. One of two things will happen this holy week: The market will pick up due to a low volume of traders; or the market will slide under the pressure of sell-off of the last three weeks.
As a trader, I cannot know for sure what will happen. Perhaps the futures market will guide the general market to rise. Therefore, futures may be leading the market more than we like to think.
Perhaps the dollar will set the stage, or oil will send a clear message. Bottom line is, Ford stock is in better position technically than GM.
One issue to beware, though. The VectorVest system which I track is a hair away from giving a confirmed down signal. That means playing stocks more to the downside, not the upside until the VVC tells us it’s clear.
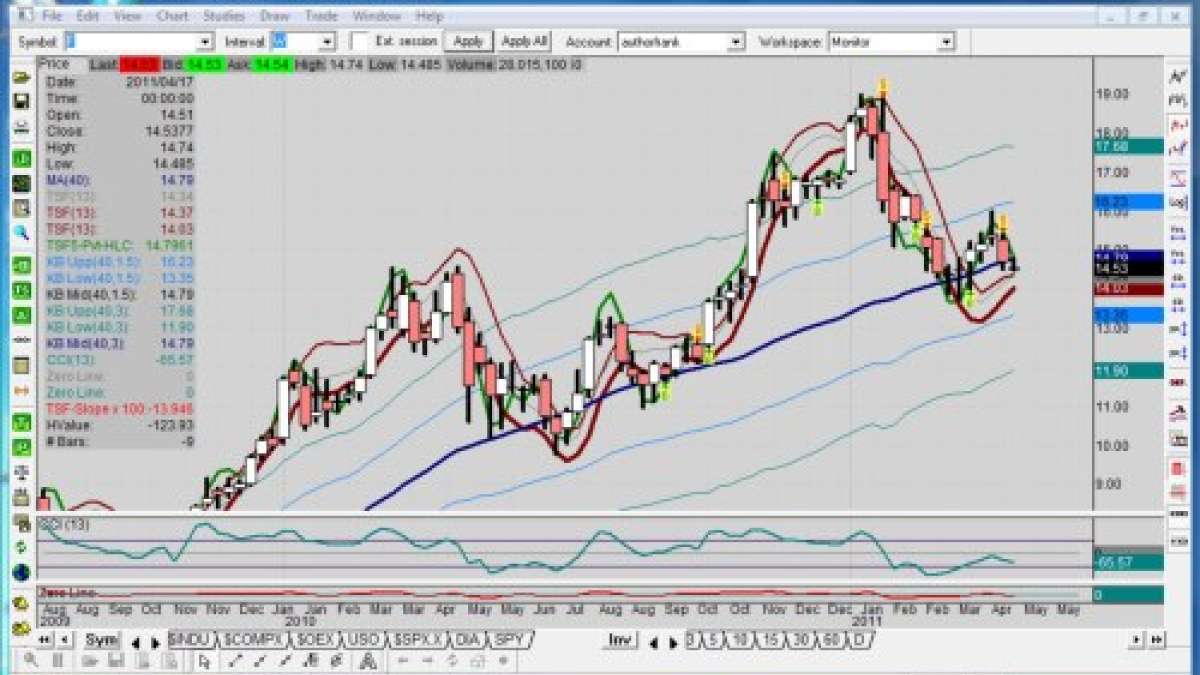
The Chart
Will Ford stock break lower this week? I do not know for sure, but the trend bias seems to indicate that the general market has a great influence over buying levels.
Still, the chart shows Ford stock with price support at 13.75, a recent swing low. Below that there is resistance at previous swing high of 13.24 that was broken in October, 2010.
For the record, this trader prefers to use tools of technical analysis that are less laggard to decipher a trend bias. For example, rather than use the standard moving averages, I choose to use the Time Series Forecast, a technical analysis tool that uses statistics. In fact, many neural networks use similar algorithms as part of the automated forecasting process.
The Time Series Forecast indicator displays the statistical trend of a security's price over a specified time period. The trend is based on linear regression analysis. Rather than plotting a straight linear regression trendline, the Time Series Forecast plots the last point of multiple linear regression trend lines. The resulting Time Series Forecast indicator is sometimes referred to as the "moving linear regression" indicator or the "regression oscillator."
The interpretation of a Time Series Forecast is identical to a moving average. However, the Time Series Forecast indicator has two advantages over classic moving averages. Unlike a moving average, a Time Series Forecast does not exhibit as much delay when adjusting to price changes. Since the indicator is "fitting" itself to the data rather than averaging them, the Time Series Forecast is more responsive to price changes.
In the case of the Ford stock chart, I have chosen the TSF5 or 5-period based on the close, and the TSF13 based on both the high and the close, thus creating a channel. The last daily TSF5 turn was down and indicated a Sell condition on April 7th. There has been no Buy signal using that daily indicator since; and the weekly chart shows the same.
What to do? Buy and hold anyway? Not me. With all respect, I prefer the market to tell me when to buy, but those price support levels are surely potential levels, unless big money comes in early and says otherwise.
Disclosure: Frank Sherosky, creator of the chart and author of "Awaken Your Speculator Mind" does not hold any stock or option positions in this equity at this time.
---------------------------------------------------------------------------
About the Author: After 39 years in the auto industry as a design engineer, Frank Sherosky now trades stocks and writes articles, books and ebooks via authorfrank.com, but may be contacted here by email: [email protected]
________________________________________________
Additional Reading:
GM stock officially trades below 30 level
Scuderi says 50-plus mpg achievable with turbocharged split-cycle air-hybrid engine
GM ranks above in clean-energy patents
EPA sets milestone for alternate fuel industry with regulation amendments
Buick LaCrosse with eAssist on par with highway fuel economy of compacts
Scuderi Air-Hybrid Engine technology setting up to challenge electric hybrids
Stop-start technology to advance more micro hybrids by 2016
Four alternate engine technologies for 2011 and beyond
Set Torque News as Preferred Source on Google
Follow us today...


Comments
MARKET UPDATE: Ford closed
Permalink
MARKET UPDATE: Ford closed today at 14.62
Your right dude, as per Ford
Permalink
Your right dude, as per Ford previous 3years performance, market structure, ford vehicle line up & Toyota's biggest ever recalling efforts which reduced the Toyota PR, all are giving a clear signs that Ford going to post a Good results in feature.