
According to Marketwatch, U.S. stock indexes fell about 1% Monday. Some blame the move on investors as they supposedly reacted to the government's March jobs report, released Good Friday when stock markets were closed. For the record, the report showed less growth than analysts expected.
The Dow Jones Industrial Average fell 130.55 points, or 1%, to 12,929.59. The S&P 500 lost 15.88 points, or 1.1%, to 1,382.2. The Nasdaq Composite lost 33.42 points, or 1.1%, to 3,047.08. For reference, see the SPY here, a chart of the ETF representing the S&P 500.
Looking at the charts, Oppenheimer’s chief market technician, Carter Worth, stated on CNBC that the DOW and SP500 had broken their uptrend lines; and that this was looking more than just a short-term pullback. Of course, there are always two sides to a story, and many other analysts on CNBC were not as worried.
Whether you believe in the return of the auto sector or not, though, today’s general market sell off was also sufficient to drag down the auto sector stocks as well, including the majors; like General Motor Company (NYSE: GM), Ford Motor Company (NYSE: F) and Toyota Motor Company (ADR: TM).
Fact is, the general market is akin to the tide of the oceans; meaning, it most often will raise and lower all ships. The exceptions are thus to be noted and watched as being contrary. This explains why you see the charts of individual stocks paralleling the charts of the indexes.
GM Stock Chart
GM stock sold off today to close at 24.20. It is still above the 150 Day Moving Average; meaning, it is still in the bullish mode from that perspective. However, the daily chart shows a breakdown of the highs and an increase in lower lows, the telltale signs of the sell off.
Price dynamics also tell us that the trend bias has shifted to being short-term bearish. This does mean the fundamentals have turned sour, but the general market’s influence on buying and selling has become greater.
As a reference, read my previous article on GM stock: GM stock surprisingly makes the Top 30 of the Billionaire Hedge Fund Index.
Ford Stock Chart
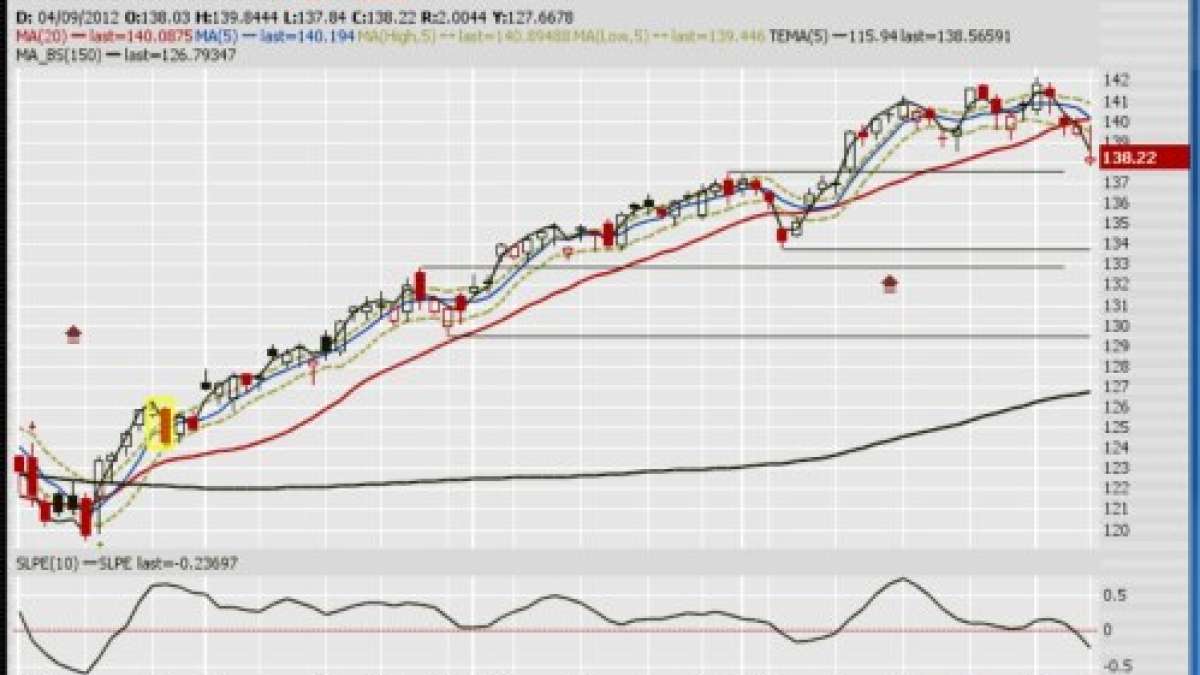
Ford stock sold off today as well, closing at 12.22 while its 150 Day MA is at 11.45. The price dynamics of F chart shows a sideways movement had been in place since early February. This latest downdraft shows ready to test the 12.00 level which was the support levels from four weeks ago.
For my perspective on Mulally, read: Ford CEO Mulally compensation rings a familiar bell
Toyota Stock Chart
TM stock sold off as well. Recall that I wrote a about a week ago that TM looked like the upward trend bias was intact, whether the 2012 New York Auto Show agreed or not. Well, add to the mix a strong downdraft of the general market and even a stellar performer like TM will eventually bow to the selling pressure.
Also read my previous report on TM: Toyota stock upward trend bias intact, with or without 2012 New York Auto Show
Bottom Line
Watch this market closely. No matter how well the auto sector may selling cars, the stocks involved are still subject to higher forces; and that higher force is the general market.
I have great respect for the technical opinions of Carter Worth of Oppenheimer. In fact, I too use his 50 day and 150 day moving average approach rather than the 200 day moving average. In addition, I sometimes tweak the 150 day average to be weighted.
Regardless of your own technical tools to decipher market price dynamics, just be apprised that this latest bull run is well over 14 weeks old. So, putting my actuarial hat on, that’s no longer a young bull run; and maybe it’s time to give it a pause.
Set Torque News as Preferred Source on Google
Follow us today...


