
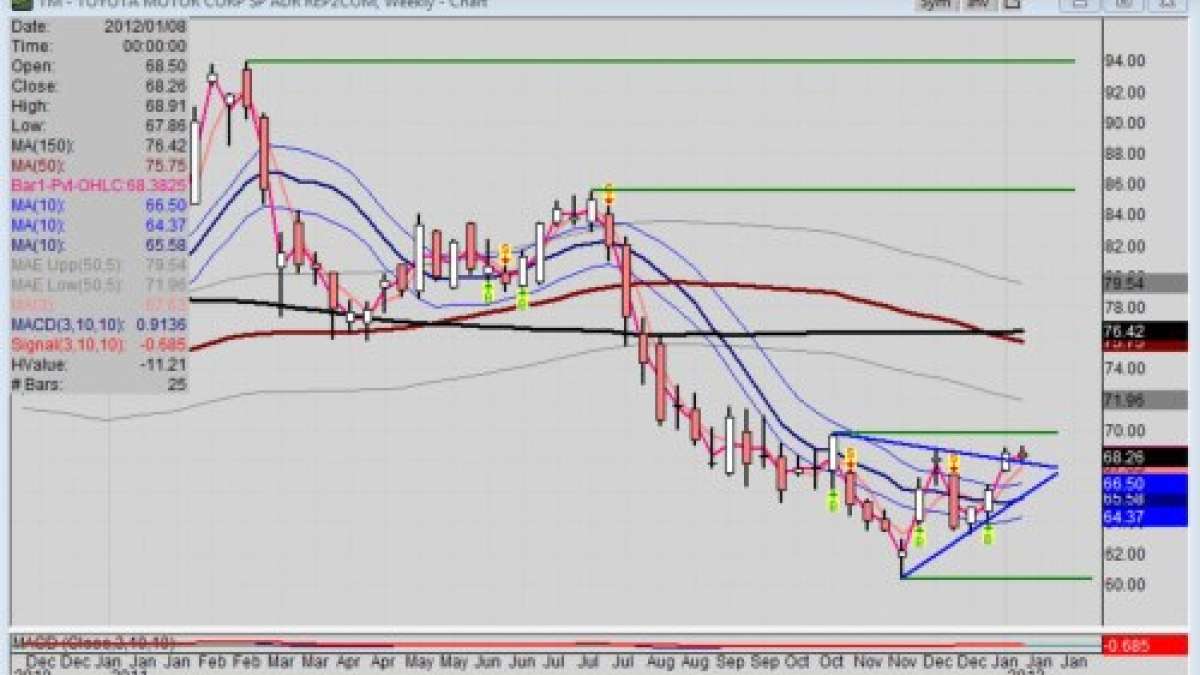
If the technical pattern on the weekly chart of Toyota Motors (ADR: TM) stock looks familiar, you are correct. Most auto sectors stocks seem to show the same wedge or overhead resistance pattern being broken. Question for Toyota stock is, will it last?
The Detroit Auto Show, better known as the North American International Auto Show (NAIAS), is in public-viewing mode now, with the Press Preview and Industry previews over and done. Now, it’s in the hands of the public to determine which car will fill their needs for 2012 and beyond.
Fundamental Outlook
For the record, Moody's Investors Service affirmed the Aa3 senior unsecured long-term ratings of Toyota Motor Credit Corporation (TMCC) and its supported subsidiaries last month, and changed the outlook to negative from stable.
Toyota Motor Corporation may be headquartered in Toyota City, Japan, and is Japan's largest automotive manufacturer, but TMCC is headquartered in Torrance, California, and is Toyota's US captive finance company.
Point is, anytime a credit rating agency like Moody’s resets a rate, the news alone often will affect a stock with volatile pricing for a few days. Not so with Toyota stock; then again, that was pre-holiday trading. Still, smart traders have been searching for the underlying reason behind the rating.
In the case of TMMC, the rating is based on methodologies such as Analyzing The Credit Risks Of Finance Companies published in October 2000, and Rating Non-Guaranteed Subsidiaries: Credit Considerations In Assigning Subsidiary Ratings In The Absence Of Legally Binding Parent Support published in December 2003. All this per Moody’s.
Nonetheless, a collateral reason not readily or openly mentioned surrounds the value of the Yen. I had heard via the CNBC reporting of Phil LeBeau that the appreciation of the Yen would affect the profits in 2012, which Toyota noted in Japan that they would improve significantly post floods in Indonesia.
Fact is, Toyota has enjoyed a depreciating Yen for many decades, but that may be changing. The US dollar is acting more like reserve currency since the Euro problems emerged. So, any appreciation of the USD means any profits returning to Japan from America, for example, would result in a lesser amount due to the Yen’s appreciation against the US dollar. Still, many Japanese and European companies are now increasing production in the U.S.
Product Outlook
From my view of the NAIAS 2012, Toyota is in a good place with its Prius line and its new Camry hybrid. Kind of interesting, though, how the larger Camry is priced less than the smaller plug-in Prius. Wonder how that will work out? I’ll have a separate report on that.
In the meantime, I'm preparing a gallery of photos of the Toyota display at the NAIAS 2012 in Detroit. I'll have it uploaded soon. In the meantime, here's one of my vidoes atthe Toyota display.
Toyota Stock Chart
Establishing a 52-week low just a few months ago, Toyota stock price dynamics show the company is being perceived as recovering from the negative effects of the earthquake and tsunami in Japan last year, and the floods at plants in Indonesia.
Looking at the price-time chart, I find TM with major swing resistance at 69.81; and the major swing support at the new 52-week low of 60.37 of 11/23. Further above, I find major resistance at 85.49 and 93.90. Those are far away, but TM stock has moved in big chunks before, especially when the market perceives conditions for profits to be right.
Looking again at the weekly chart, you will notice the two converging blue lines. These are trend lines that have defined a wedge pattern. This means TM is in a state of uncertainty; at least until price popped above the descending upper resistance line.
Last month I wrote the following: “It is neither rising or falling with any significance. That also means that pressure is building for a breakout to the upside or the downside.” Well, the breakout to the upside has occurred, but not with any great conviction. I think we need another week of confirmation.
I also wrote that I would let the fundamentals help decide which direction. Be assured, the negative news out of Europe still has major bearish weight these days on everyone, especially auto companies. Nonetheless, the tone at the NAIAS 2012 in Detroit implies grater enthusiasm, and all those cars on the road are not getting any younger; many in the 8-10 year range. That implies demand is on the horizon.
My own thoughts are this: I like Toyota stock as a trade. Question is, should I sell a put option for income? Then if the stock pulls back, I may get the stock put to me, but will have been paid for the wait. Or should I buy a longer term call option? Then again, the hoopla of NAIAS 2012 will die soon; and there may indeed be a pullback to the 65 level.
Trading can be very profitable, but nobody, including me, ever said trading was easy!
_______________________________________________
Full Disclosure: At time of publication, Sherosky, creator of the auto sector charts for TN, is neither long or short with the mentioned stocks or futures, except some call options on Ford, though positions can change at any time. None of the information in this article constitutes a recommendation, but an assessment or opinion.
Set Torque News as Preferred Source on Google
Follow us today...


