
Follow us today...


First, looking back to the negative front, Toyota Motors (ADR:TM) had the cheaper labor of Thailand being offset by the weather. Problem was, this weather is cyclical as monsoon rains return every year; but this year produced floods not seen in many decades.
Now, Toyota is signing a memorandum of agreement (MOA) with BMW for exchange of technical knowledge up to and including exchanging German diesel engines in Europe for knowledge of lithium-ion battery development.
Recall it was just four weeks ago when Toyotas Motors (ADR:TM) stock was trading over $69. Just last week it was treading water at the $64 level.
Good news of Toyota is, the company announced a return to production due to the floods near three Thai assembly plants. Furthermore, this announcement with BMW at the Tokyo Auto Show
Of course, in the economic world, Toyota stockholders have had to deal with the general market sell-ff from the Greek problems and now Italy which might drastically affect European sales.
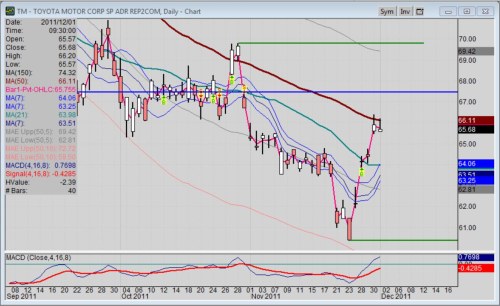
Toyota Stock Chart Assessment
So, where should traders look for Toyota stock to trade at this point? Recall that major support from 2010 at 67.57 had been broken and retested for weeks now. Furthermore, that major support (now broken) still stands as major upside resistance, not to mention the 50-day moving average is well below the 150-day moving average, a definite macro-bearish implication.
The recent swing low of 60.37 is intermediate support, while the swing high of 69.81 on 10/28 stands as upward swing resistance; and that defines the swing range whereby these latest price gaps to the upside have yet to breach.
For the record, the next level of major support level dates back to the lows of late 2008 and early 2009 which stands at the 57 level.
Will TM test the upper resistance levels at 67.57 and 69.81? In time, that is likely to happen, especially with bullish gaps implying a bullish sentiment for Toyota stock. However, as I wrote last time, any good news can surely drive TM higher, but the economic conditions in the world will likely act as a heavy burden; and it’s difficult not to still believe in that scenario.
Furthermore, technical traders firmly believe that gaps like to get filled because the market somehow deplores a vacuum. Well, TM has at least three gaps on the daily chart for the past five days alone; so a pullback would not be a surprise unless an early Santa Claus rally this year becomes over exuberant.
-----------------------
Full Disclosure: At time of publication, Sherosky, creator of the auto sector charts for TN, is neither long or short with the mentioned stocks or futures, though positions can change at any time. None of the information in this article constitutes a recommendation, but an assessment or opinion.
-----------------------
About the Reporter: After 39 years in the auto industry as a design engineer, Frank Sherosky now trades stocks, futures and writes articles, books and ebooks like, "Perfecting Corporate Character," "Awaken Your Speculator Mind", and "Millennial World Order" via authorfrank.com. He may be contacted here by email: [email protected] and followed in Twitter under @Authorfranks
________________________________________________
Additional Reading:
GM stock trading reveals uncertainty to details of Volt investigation by NHTSA
GM says de-charging after severe crashes to define new safety protocol for Chevy Volt
EV halo effect officially fades with Green Car of the Year at LA Auto Show
GM stock breaks below price support one day before option expiration
CODA Automotive touts 150 mile EV range at 2011 LA Auto Show
GM stock tanks on open after beating earnings estimates
Toyota stock price dynamics still show bearish trend bias
Follow us today...