
Follow us today...


The IPO offering of 33 and the open at 35 has yet to be reached since the recent sell-off, but the chart pattern for General Motors (NYSE: GM) stock is now looking stronger since its lows in June.
Question: Is there a fundamental reason for the GM stock rebound, like sales? Torque news writer, Patrick Rall, will likely cover the sales in a separate report.
On the other hand, GM is reorganizing once again (no surprise there) but this time within the Global Product Development. See my latest TN article,
GM rearranges deck chairs in global product development
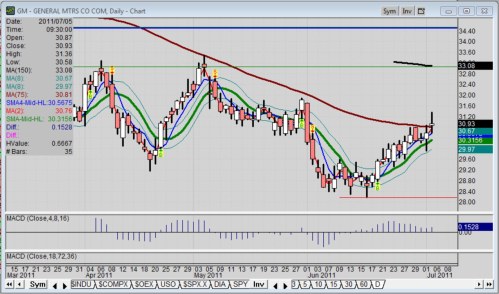
From a price-chart technical perspective, GM stock is pressing against the 75-day moving average, one-half of the 150-day moving average touted by Carter Worth of Oppenheimer featured on CNBC.
The stock is also pressing against past price support at 33 which is now viewed by market technicians as overhead resistance. This change in status occurs when past price support is broken. For the record, even the legendary trader, W.D. Gann, viewed broken support in this manner.
Recall that GM stock was initially offered at 33, but opened higher in November, 2010 at 35. It later traded as high as 39.48 then trailed downward for months to break all IPO price support. It even broke past 30 and made a new low of 28.165 in June.
Of course, GM stock is driven by the general market as most stocks are, but once in a while a stock will go rogue; some up, some down based on their own fundamentals or the emotions of traders, especially hedge funds who often wield large blocks of shares.
Where does GM stock go from here is anyone’s guess, but the chart pattern seems to indicate the June low is strong support and confirmed as a lower limit, at least for the meantime. If it wasn’t, then the price pattern wouldn’t show strength to the upside at this juncture.
As far as upside limit, look again at the 75 day moving average and the 150 day moving average. Also look at 33 and 35 as potential future targets, the prices established on IPO day.
Any market technician will tell you that it is significant note when two separate technical indicators coincide, as do the 150 moving average and the IPO day low of 33.
Full Disclosure: At time of publication, Sherosky, creator of the auto sector charts for TN, is neither long or short with the mentioned stocks for futures, though positions can change at any time. None of the information in this article constitutes a recommendation, but an assessment or opinion.
-----------------------
About the Reporter: After 39 years in the auto industry as a design engineer, Frank Sherosky now trades stocks, futures and writes articles, books and ebooks like, "Perfecting Corporate Character," "Awaken Your Speculator Mind", and "Millennial World Order" via authorfrank.com. He may be contacted here by email: [email protected]
________________________________________________
Additional Reading:
State business ranking by CNBC reflects same criteria important to auto industry
Why Obama's proposed CAFE standards to 56.2 mpg IS feasible
Is it time to protect your auto sector stocks?
GM to explore advanced natural gas engine technology
T. Boone Pickens touts natural gas vehicles in Washington, D.C.
Ram Trucks with natural gas could set a new trend in America
Fiat has tech savvy to lead America into natural-gas cars
Follow us today...
Comments
GM has been with us for
Permalink
GM has been with us for decades. I hope nothing bad will happen to them. I love their cars!
Congratulations, GM, for a
Permalink
Congratulations, GM, for a job well done! And we thought that you can't get back on solid ground again! Again, congrats!