
Follow us today...


On a fundamental scale, Honda Motor Company (ADR: HMC) has the usual set of fine products being delivered to the world market. On the stock performance side, though, things have been a bit more volatile and driven by the Yen’s relation to the dollar, not to mention by the general market’s price actions.
As you know, Honda Motor Company reported last Tuesday that U.S. April sales fell 2.2% to 122,012 vehicles from 124,799 a year ago. For the record, U.S. sales of the best-selling Accord in April rose about 26% to 35,385 vehicles from a year ago.
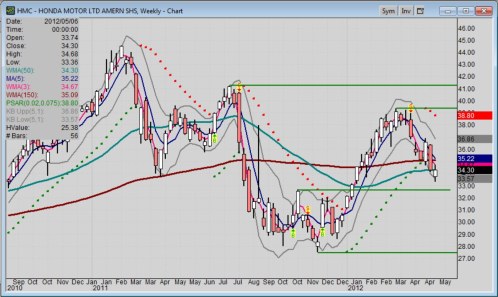
Now look at the weekly chart for HMC. Looks a lot like of other stock patterns to me. There is a major low in the fall of 2011, followed by a peak in March that has since faltered. Check out a Toyota chart, for example, and it looks similar; just different price levels.
In particular, Honda stock’s support and resistance levels are as relevant as any other stock, because these turning points define where a changing of the guard from bull to bear and bear to bull occurred. And since market history has the proclivity for repeating itself, chances are past support levels and resistance levels will likely be challenged. Right now, HMC is about to challenge the lower 32.65 level, a past high that was broken. Honda closed Friday at 34.30.
Just be apprised that an upper resistance level when broken becomes future support. Likewise, when lower support is broken it becomes future resistance. And that’s how the game is played as traders watch these levels like a soaring hawk circle the air for prey.
Honda Stock Chart
On the high end, I see upper resistance first at the 39.35 level. Above that, another resistance level is 41.23 that dates back to last summer.
On the lower end, I already mentioned the 32.65 level. At 27.52 is a firm bottom. Whether that level will be tested this year is anyone’s guess. Fact is, nobody knows, not even the pro traders.
What is important are the factors that might contribute to Honda testing any of these levels, like new news, appreciation or depreciation of the Yen or the US Dollar. And you will have a decision to make as usual: buy, sell or hold if you already own shares.
For the record, I do not own any HMC stock at this time. Right now, I am operating under my own system that shows a sell trend bias on the weekly chart, a more long-range look. The WMA3 (3-bar weighted moving average) is still below the MA5 (dark blue 5-bar moving average) central line of the Keltner Band (noted by the grey lines).
Be apprised, though, on a daily chart the upward crossover of the WMA3 and the MA5 just occurred, but has not been confirmed by an up-close bar, where the close is higher than the open. (Hey, it’s my system, my rules and I try to obey them just to keep some sense of discipline.) Perhaps Monday’s close will help change that status.
Nonetheless, the intermediate trend bias on the daily chart is still bearish, as the MA5 is below the MA50 (50-day moving average); and the MA50 is above the MA 150, a major relationship, but it is converging fast toward a possible cross below it. So, the weekly trend bias with the WMA3 below the MA5 will remain bearish for a while yet.
What does this really mean? Well, things can change intra-day at any time, but the charts which measure price dynamics are not confirming anything bullish yet. That also means the testing of the 32.95 support level will be more probable than not; especially when the general market is giving so many bearish tones of its own.
If I was to be bullish on Honda stock from a fundamental view, I might wait for it to test that 32.95 level. If it does, then I might consider selling put options for income until I get filled; as it is a bullish options strategy.
The weekly chart also has another message within it, though. The 50-week WMA is below the 150-week WMA. Of course all changes are first registered on the daily chart just as they registered ahead on the intra-day charts. So, I will keep this on my watch list and let you know when I see that trend changing.
Follow us today...