
Follow us today...


So, what’s wrong with General Motors stock (NYSE: GM)? Truth is, the same thing that’s wrong with Ford stock, which is trading back in the $14 area.
Just don’t blame it on that song that says, “Monday, Monday. Can’t trust that day!”
Fact is, high oil prices has led to high gasoline prices. U.S. gasoline prices on Monday rose a penny to an average of $3.51 a gallon for regular unleaded, according to the AAA Daily Fuel Gauge Report. And California, for example, has the highest gasoline prices in America now above the $4 mark in some places.
Of course, the U.S. automakers are better prepared this time with lineups of far more efficient vehicles. Chevrolet has the extend range Volt and the Chevy Cruz Eco, while Ford has the Focus with an EV version right around the corner.
Question is, are automakers still barking up the wrong fuel tree? Those lithium-ion battery vehicles are not cheap enough yet for the masses. So, what will it take for the automakers and the Obama administration to get their heads out of the lithium sand and into the natural gas tank?
Face it. Natural gas is the only real solution for cheaper energy for America.
In the meantime, you will watch GM stock and others sink until buyers come back in. When will that be? At what level? You tell me.
Ford at least has a price history. The new GM stock does not, except the memory of prices before it went bankrupt the first time. Yes, that can happen again; unlikely, but not impossible.
Stock Chart Review
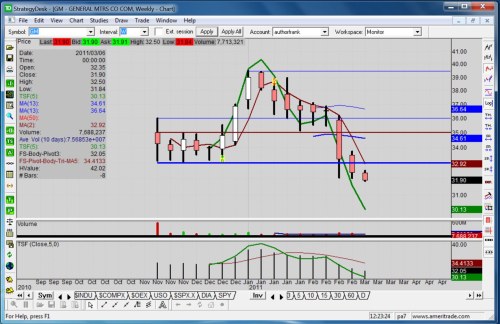
We know the official IPO price was $33, but the market opted to open higher at $35. Then the future wizards of stock analysis came out and projected $50 plus for the stock. Well, it stopped way short of that, at $39.48.
Now we have soundly broken the IPO price by trading today below $32, even if only on an intraday level as of this writ. Nobody knows how long that will last or how much lower it will go. Perhaps the oil and gasoline prices are your real gage this month, more than projected earnings per share.
That green technical line on the weekly chart represents the Time Series Forecast that I use extensively, because it is not a laggard like moving averages. As of noon on Monday, it is indicating 30.11. Personally, I’m not long on GM stock until that line rises, and it will rise first on the daily chart before it shows up on the weekly.
Then again, today’s only Monday. Perhaps Tuesday through Friday will fare better, but my trust-but-verify tool will be the Time Series Forecast plus higher highs and higher lows.
Disclosure: Frank Sherosky, creator of the chart and author of "Awaken Your Speculator Mind" does not hold any stock or option positions in this equity at this time.
-----------------------
About the Author: After 39 years in the auto industry as a design engineer, Frank Sherosky now day trades, writes articles, books and ebooks via authorfrank.com, but may be contacted here by email: [email protected]
______________________________
Additional Reading:
Air hybrid technology key to 2016 and 2025 truck fuel economy
NGVAmerica expects growth of natural gas in vehicles to continue in 2011
General Motors reports earnings of $4.7 billion in 2010
Follow us today...