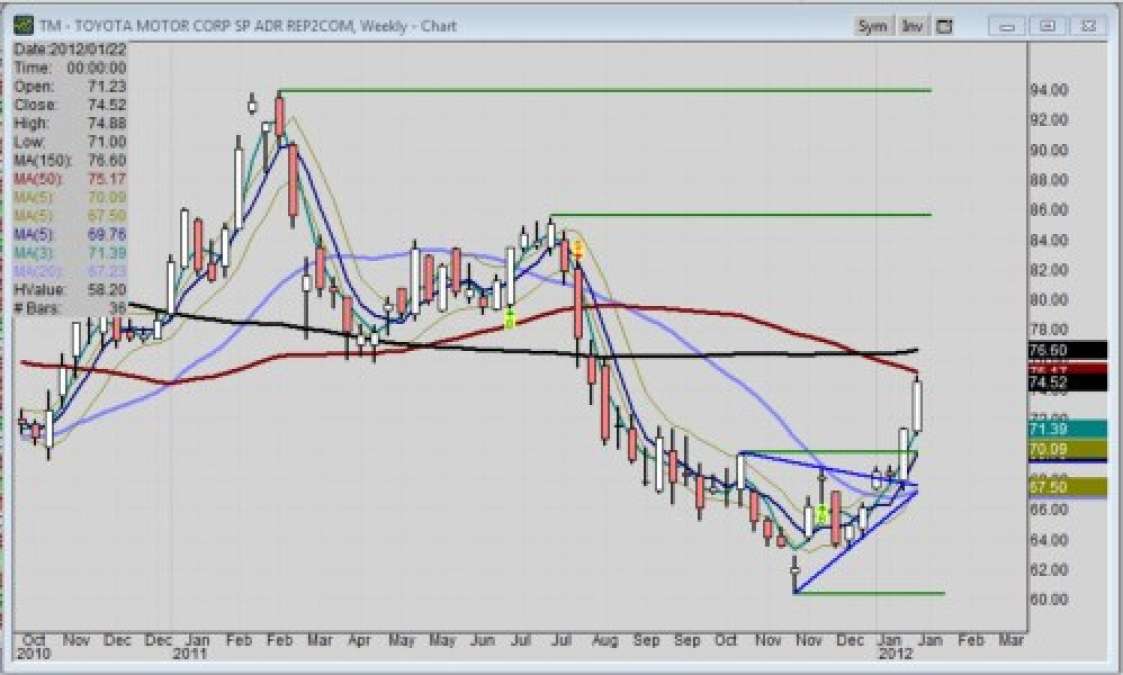
If the technical pattern on the weekly chart for Toyota Motors (ADR: TM) stock looks like a breakout, then we are in agreement. As most auto sectors stocks seemed to show the same wedge or overhead resistance pattern being broken, Toyota stock is not only confirming the breakout to the upside, but that the upward move is sufficient to say the bottom is in and the trend bias is turning strong towars bullish.
The stock is now trading above a rising 20-week moving average, and nearing the 50-week moving average, which just crossed below the 150-week moving average and looks bearish in the long-term sense. However, just be apprised that short-term averages always move first, by their very nature, before the longer-term indicators. Fruthermore, the 150-week moving average has turned up.
The Detroit Auto Show, better known as the North American International Auto Show (NAIAS), with the Press Preview and Industry Previews is done. So, the public will determine which car will fill their needs for 2012 and beyond; and, by the performance of Toyota stock the past two weeks, investors are voting on Toyota.
Nonetheless, the tone at the NAIAS 2012 in Detroit implied greater enthusiasm than anyone expected, and all those cars on the road are not getting any younger; many in the 8-10 year range. So, that implies demand is on the horizon for all automakers; and Toyota is set once again to provide the products.
My own thoughts ten days ago went like this: I liked Toyota stock as a trade. Question was, should I sell a put option for income? Then if the stock pulled back, I could get the stock put to me, but would have been paid for the wait. I also could have purchased a longer term call option. As a writer, I chose to hesitate, because it’s not kosher to trade within 72 hours of an article, especially for a new position. Of course, I could have disclosed it.
Then again, just like the hoopla of NAIAS 2012, all enthusiasm comes to an end or dies down; and there may indeed be a pullback to the broken resistance level. So, waiting for the pullback at least insures to a greater degree that Toyota’s trend bias has changed from bearish to bullish.
Toyota Weekly Stock Chart
Establishing a 52-week low just a few months ago, Toyota stock price dynamics showed the company was being perceived as recovering from the negative effects of the earthquake and tsunami in Japan last year, and the floods at plants in Indonesia. That appears to still be in play.
Looking at the price-time chart about ten days ago, I found TM with major swing resistance at 69.81; and the major swing support at the new 52-week low of 60.37 of 11/23. Now I find TM sitting well above that resistance level at 74.43 as of 10:30 a.m. today. That makes the 69.81 a new level of support, because broken resistance becomes new support.
Further above, I still find major resistance at 85.49 and 93.90. Those may be far away, but TM stock has moved in big chunks before, especially when the market perceives conditions for profits to be right. Just witness what it has done the past two weeks. And look how many price gaps in a daily chart which are hidden within those long bars of the weekly chart.
Still, there will be pullbacks, and nobody knows how far TM might run this time before profit taking take over.


