
Follow us today...


Even before this latest news came out as Breaking News on CNBC, Toyota stock had bucked the depth of the recent market sell off by merely shaving lightly from its price the past seven weeks. That in itself tells us investors had been staying with the stock, literally discounting to some degree the bad news in Japan.
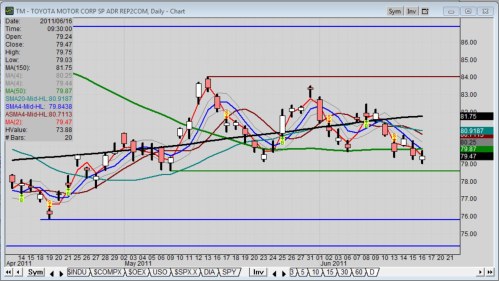
Still, a quick look at the daily stock chart shows TM trading below the MA150 (150-day moving average), my new choice for long-term trend reference, thanks to Carter Worth of Oppenheimer, a guest on CNBC’s Fast Money.
In addition, TM is also trading now a bit below the MA50 (50-day moving average), which in itself is also below the MA150. That tends to indicate the trend bias is bearish. With a daily-chart channel high of 84.00 and channel low of 78.62 for the past 30 trading days as reference, today’s close was 79.47, the lower end of that channel.
From a weekly chart perspective, though, the lower limit of the channel sits at 75.85, with the next weekly-support prices below that at 69.32 and 67.56 respectively.
I have personally confirmed the general bearishness of the stock within my own proprietary trend-bias indicator based on a 4-day channel breakout to the downside.
Bottom line is, the new news about a return to full production from the supply problems induced by the earthquake and tsunami in Japan did not have a major influence over today’s close, albeit TM closed higher than yesterday.
Looking forward, it’s difficult to predict if TM will go much lower. It seems the wavelike pattern of the MA4 (4-day moving average) channel almost foretells the down moves provide at least a repeatable opportunity to go long for some short-term gains; the average time upside upon breaking the channel is almost 3 days.
That may be good enough for a short-term swing trader like me, but not for long-term investors. Still, long-term investors can use these swing patterns as points of entry if they so desire. In my mind, I would still prefer buying wholesale over retail, even if my time horizon is longer than 3 days. The fact the pattern exists at all tells me some bigger market players may be doing exactly that; otherwise, Toyota stock would be making a whole lot more lower lows and lower highs, and with much greater depth.
Full Disclosure: At time of publication, Sherosky, creator of the auto sector charts for TN, is neither long or short with the mentioned stocks, though positions can change at any time. None of the information in this article constitutes a recommendation, but an opinion.
-----------------------
About the Reporter: After 39 years in the auto industry as a design engineer, Frank Sherosky now trades stocks, futures and writes articles, books and ebooks like, "Perfecting Corporate Character," "Awaken Your Speculator Mind", and "Millennial World Order" via authorfrank.com. He may be contacted here by email: [email protected]
________________________________________________
Additional Reading:
Toyota Motor Company stock price action is robust within market sell-off
Ford Motor Company (NYSE: F) stock still sliding lower
GM stock breaks to new low, the 6th in past 11 days
Toyota requests dismissal of shareholder suits over unintended acceleration
Follow us today...