Although Tata Motors (ADR: TTM) reported more than a two-times jump in its fourth-quarter consolidated net profit, beating estimates, the company also said it wrote back GBP217 billion of tax at Jaguar Land Rover during the past quarter. Yes, that read as a billion, but there is a catch; so read on.
More important, analysts consider any action like a writeoff as key to understanding the price action; and that is why Tata Motors (ADR: TTM) will likely endure some volatility for at least the next few days.
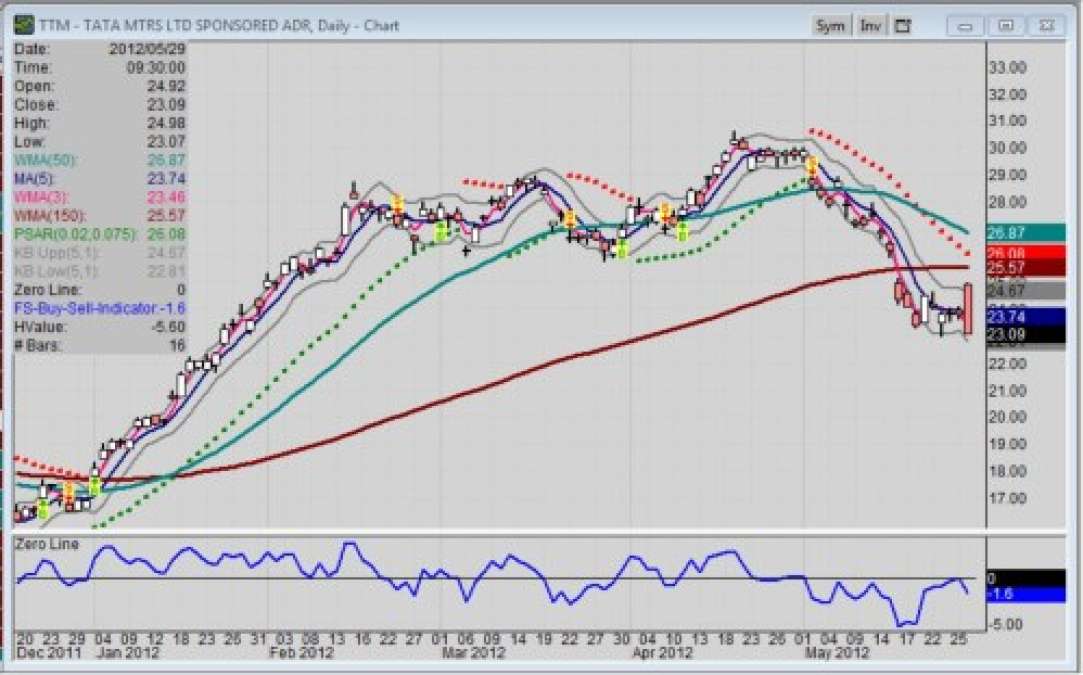
That is also why stock charts are so important to traders. It is the price action after the news that counts more than the news itself. In the case of Tata Motors, the daily chart shows a pop upward on the open, but it fell back after that. This is not a bullish action at all.
Then, MarketWatch which reported directly from New Delhi, the home of Tata Motors, had to include a correction. Tata Motors later admitted that it had misstated the amount of tax write-back in the 5th paragraph, whereby the tax writeoff was GBP217 million, not billion. So, MarketWatch provided the correct version from Tata Motors but still confirmed the more than twofold jump in the company’s fourth-quarter consolidated net profit, beating estimates was intact.
Tata specifically noted that profit in the January-March period rose to INR62.34 billion from INR26.38 billion a year earlier. MarketWatch was quick to catch that beat the INR37.14 billion average of estimates in a Dow Jones Newswires poll of 11 analysts. In addition, sales climbed 44% to INR506.09 billion from INR351.48 billion.
Traders, though, still did not like the amount of writeoff, where the daily stock chart as you can see is still negative. The stock is just above the 23.00 level, but still trading under the 150-day WMA (weighted moving average), and the 50-WMA is fast converging toward that 150-WMA line and may cross below it. If that happens, it merely confirms what the short-term indicators have been telling us: bearish trend bias. Now the question is: Where is the level whereby buyers will come back in?
Especially note the latest bar shows as red, meaning the latest price is well below the open. No doubt, today is a bearish day for TTM, regardless of the earnings report. How long that will ride is anyone’s guess. However, we can look back to find past support levels.
More Chart Reading
Looking to the weekly chart (not shown here), I found broken resistance at the 21.96 level dating back to late October, 2011; and that is now considered future support. The next major support level on the weekly chart dates back to early October, 2011 at the 14.33 level.
So, TTM will have to be watched very closely, especially if you are looking to invest. Still, the best bet may be to act patient. Let the moving average tell you when it’s safer to jump in; on other words, when it is in your better interest with probability more likely on your side.


Comments
With today's further selloff
Permalink
With today's further selloff (May 30), I wish I had bought put options. The depth of the plunge, though, makes me wonder all the more if that 14.00 support level will truly be tested.
The next broken resistance level is 18.73 dating back to 12/5/2011. Should have mentioned that level as well in the article. So, it has to breach that key level first.