
Follow us today...


One hour after Wednesday’s open which fell sharply, some GM stock buyers came in at 30.20.
Unfortunately, an IPO doesn’t have the past history of price dynamics like mature trading stocks. So, the only recourse for traders and investors alike is to use technical analysis from an absolute reference point.
Once an old high or low is broken, though, as was last week’s low of 30.65, that means rather than using a previous price level like a swing high or swing low, you have to use absolute numbers like 30, 25, 20, etc.; or percentages of the IPO price like one-half of 33 or 16.5; or two-thirds of 33 at 22. Truth is, that’s all you have besides increments of book price.
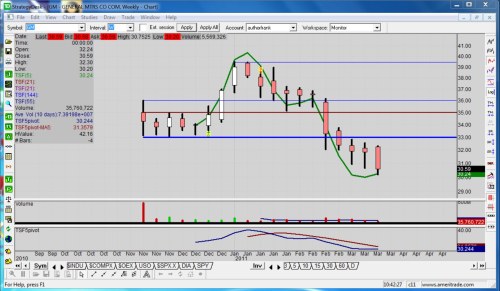
In the case of GM stock, the IPO official price was set at 33, but opened higher at 35. Shortly after that, the stock tested the 33 level and rose higher. Some analysts projected the stock would rise to the mid-50s. That did not happen, though, as the highest price attained thus far has been 39.48.
As of this week, GM stock is still in a sell-off position, despite a large gain by the general market on Monday. Will GM stock find buyers at 30? Time will tell.
For the record, this trader prefers to use tools of technical analysis that are less laggard to decipher a trend bias. For example, rather than use the standard moving averages, I choose to use the Time Series Forecast indicator.
By definition, forecasting is the process of making statements about events whose actual outcomes typically have not yet been observed. A commonplace example might be estimation for some variable of interest at some specified future date.
Prediction is a similar, but more general term. Both might refer to formal statistical methods employing time series, cross-sectional or longitudinal data, or alternatively to less formal judgmental methods.
In the case of trading, there is a technical analysis tool that uses statistics. In fact, many neural networks use similar algorithms as part of the automated forecasting process.
The Time Series Forecast indicator displays the statistical trend of a security's price over a specified time period. The trend is based on linear regression analysis. Rather than plotting a straight linear regression trendline, the Time Series Forecast plots the last point of multiple linear regression trend lines. The resulting Time Series Forecast indicator is sometimes referred to as the "moving linear regression" indicator or the "regression oscillator."
The interpretation of a Time Series Forecast is identical to a moving average. However, the Time Series Forecast indicator has two advantages over classic moving averages. Unlike a moving average, a Time Series Forecast does not exhibit as much delay when adjusting to price changes. Since the indicator is "fitting" itself to the data rather than averaging them, the Time Series Forecast is more responsive to price changes.
In the case of the GM stock chart, I have chosen the TSF5 or 5-period based on the close, and the TSF21 based on both the high and the close, thus creating a channel. Unfortunately, the weekly chart lacks sufficient data points to see the channel.
For the record, the Buy (B) and Sell (S) signals are based on my own custom signals predicated on the pivot point of three TSF signals, the high, low and close, in addition to a few other price dynamic conditions.
So, since the weekly chart doesn’t have enough data points for the TSF 21, we only have the TSF5. Likewise, I have created a secondary indicator below that shows the TSF5 pivot relative to its 5 bar moving average. As you can see, it broke lower weeks ago.
Will GM stock break 30 today or tomorrow? I do not know for sure, but the trend bias seems to indicate that has great probability; and probability is all we have as traders; never surety.
Bottom line here is, the weekly chart of GM stock, even apart from the Time Series Forecast indicator, is showing lower lows and lower highs. Nobody needs to be a market technician or a degreed in economist to tell them that this is bearish in the short and mid-term. It will turn only when the big money deems GM stock worthy.
Disclosure: Frank Sherosky, creator of the chart and author of "Awaken Your Speculator Mind" does not hold any stock or option positions in this equity at this time.
-----------------------
About the Author: After 39 years in the auto industry as a design engineer, Frank Sherosky now trades stocks and writes articles, books and ebooks via authorfrank.com, but may be contacted here by email: [email protected]
________________________________________________
Additional Reading:
Cyclone Power to run patented steam engine in land speed record attempt
Auto industry compromise with expensive EVs fails the masses
Scuderi Air-Hybrid Engine technology setting up to challenge electric hybrids
Cella Energy achievement may make hydrogen fill-up a reality
Stop-start technology to advance more micro hybrids by 2016
Four alternate engine technologies for 2011 and beyond
Follow us today...