
Follow us today...


This down move may be tied to option expiration this week when all boats go down with the tide. Although aware of that phenomenon, traders still look for fundamentals behind market moves.
For the record, the third Friday of every month is the last trading day for option contracts assigned to expire. So, it’s not unusual that many automotive stocks may sell off; especially when the general market is leading the way.
There may indeed be more to the down move, though. Take the U.S. dollar, for example. It fell today relative to other world currencies. That means it will cost automakers like Ford more money to purchase raw materials if that trend continues.
The general market has also had a giant run since last September. Even the Vector Vest system showed the trend as an Up/Up situation as recent as yesterday. Still, this is earnings season, which may exacerbate or delay any correction.
On the fundamental front, Ford is riding a strong wave from the 2011 North American International Auto Show in Detroit. Its technology displays are by far the best and most revealing of all the automakers.
The recent introduction of the Ford Focus EV and the new C-Max have been received quite well by the media and the visitors at the Detroit auto show.
No matter what the fundamentals may say, though, wise traders prefer a technical chart perspective, as price dynamics lead the way far better for timing buys and sells.
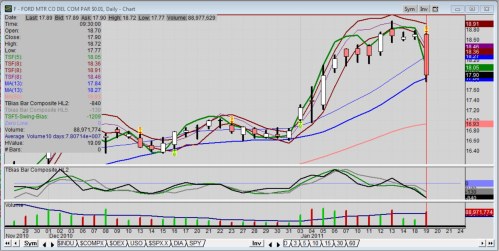
Note the price trend bias for Ford stock from the lower left to the upper right: that’s flat to bullish. The flat occurred during November and most of December. A breakout occurred to the upside on January 3rd.
The highest close was 18.77 as of yesterday. Today was the first real sell off since the start of 2011. Of course, only time will tell if we are to get lower closes, lower highs and lower lows from here. However, today’s move was on very lightly higher volume than the 10-day moving average. Then again, there are two days left for option expiration
Watch the market action though Friday when January option contracts stop trading. Question is, at what price level will buyers come back in?
Support for Ford can be subjective, depending on timeframe of the chart. However, based on the day chart shown, one can find price support at 17.10, the opening price of the breakout bar which gapped above its previous bar’s close. After that you have to go to the weekly chart for support in the 13.20 area.
Disclosure: Frank Sherosky, creator of the chart and author of "Awaken Your Speculator Mind" does not hold any stock or option positions in Ford at this time.
-----------------------
About the Author: After 39 years in the auto industry as a design engineer, Frank Sherosky now trades stocks and writes articles, books and ebooks via authorfrank.com, but may be contacted here by email: [email protected]
________________________________________________
Additional Reading:
CCS students envision 2020 Ford pickup at Detroit Auto Show
Scuderi Air-Hybrid Engine technology setting up to challenge electric hybrids
Full EVs at 2011 Detroit Auto Show not so green after all
Follow us today...